
How We Won Best Visualization at DataFest 2025
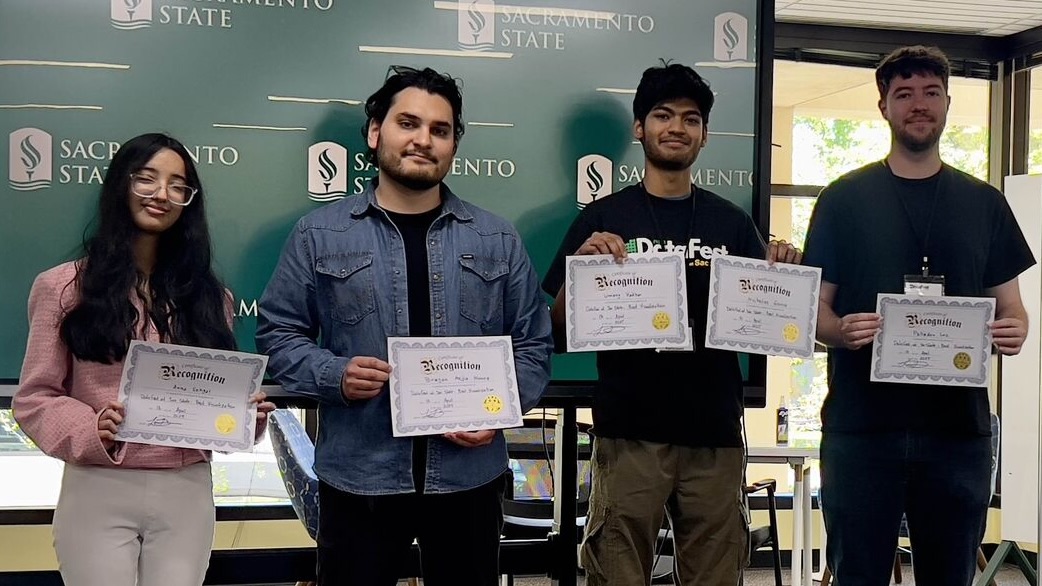
I’m thrilled to share that my team and I won the Best Visualization Award at the Northern Californina American Statistical Association's DataFest 2025! This was my first time competing in a data-focused event, and the experience was an incredible learning journey packed into one intense weekend.
The Challenge: 40 Hours, One Massive Dataset
The competition was a sprint. We were handed a massive, unfamiliar dataset and given less than 40 hours to turn it into something meaningful. The goal was to explore the data, uncover insights, and present our findings through compelling visualizations. Our toolkit included Tableau, Excel, and a variety of Python libraries.
Our Strategy: Questions First, Visualizations Second
Instead of diving blindly into the data, we started by asking the right questions. What stories could this data tell? What problems could it solve? This question-driven approach helped us focus our efforts and make quick, strategic decisions.
During our final presentation, we brought this strategy to life. We posed our key questions to the audience and let our visualizations provide the answers, creating a narrative that was both engaging and easy to follow.
Key Takeaways and New Skills
The weekend was a crash course in data science. I gained hands-on experience with data manipulation and became proficient with Tableau in a remarkably short time. Its intuitive interface made it easy to learn and incredibly effective for building impactful visualizations. I highly recommend it.
I also got comfortable working with the Google Cloud API, sending over 15,000 API calls in a short period. It was a powerful lesson in efficiency and working with large-scale data services.
A Shoutout to the Team
I couldn’t have done this without my amazing teammates. Our success was a true team effort:
-
Anna Sehgal (California State University, Chico) worked tirelessly to find the best visualization tool for our needs, ultimately introducing us to
Tableau, which elevated our entire project. -
Nicholas Eovva was the mastermind behind most of our graphs. He dove deep into Python’s visualization tools and taught us a ton about
Pandas,NumPy, andMatplotlib. -
Palladen Lee became an Excel powerhouse. His ability to create quick visualizations allowed us to iterate at the fast pace the competition demanded.
-
Umang Vadhar kept our morale high and our focus sharp. He provided timely reminders of our end goals and helped me manage the team to ensure we stayed aligned. His presentation skills were outstanding. Presenting so clearly on so little sleep is truly impressive!
A huge thank you to the event organizers, the Carlsen Center for Innovation & Entrepreneurship for hosting, and our mentors, especially Michael Berbach and Dr. Clark Fitzgerald, who helped us refine our vision.
I'm looking forward to more data-driven adventures!